|
What it Introduction
Clinical studies
Procedure |
|
Procedure (cont.)
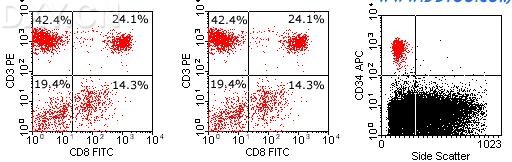
Flow cytometry data analysis. Left-hand plot show a one-colour histogram plot of CD8 expression by peripheral blood lymphocytes. Approximately 38% of events fall between the marker boundaries, and are therefore regarded as CD8 +ve. The centre plot also shows CD8 expression on PB lymphocytes, but depicts the relationship between CD8 and the T-cell marker CD3. The right-hand plot shows a population of CD34 +ve 'stem cells' plotted against side scatter. FCM vs. other techniques
|
→如果您认为本词条还有待完善,请 编辑词条
词条内容仅供参考,如果您需要解决具体问题
(尤其在法律、医学等领域),建议您咨询相关领域专业人士。
0
收藏到: